Status of Education

Figure 1a: In the yearn 2,000, the majority of students received some education. Many also received a secondary and tertiary education.
Source: KC, S. Projection of populations by level of educational attainment, age, and sex for 120 countries for 2005-2050. Demographic Research, 22, 9. Retrieved July 25, 2014

Figure 1b: The amount of citizens with not education is projected to decrease in the future, and the amount of citizens with a secondary and tertiary education is projected to greatly increase.
Source: KC, S. Projection of populations by level of educational attainment, age, and sex for 120 countries for 2005-2050. Demographic Research, 22, 10. Retrieved July 25, 2014
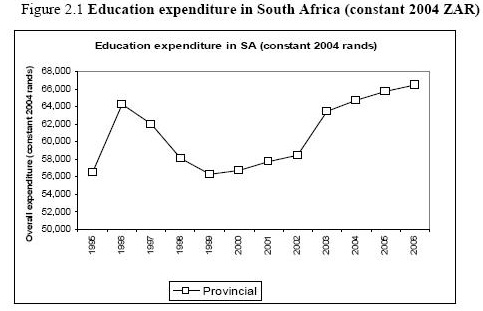
Figure 2.1: The amount of money that is designated for education is increasing steadily.
Source: Department of Education (2007b), Education/Treasury Sector Overview, 18 April, Department of Education, Pretoria
|
The United Nations Global Education Initiative was established in “September 2012 to accelerate progress towards the education for all goals and the education-related Millennium Development Goals” (globaleducationfirst.org). This initiative has three main priorities. The first priority is to make sure that every child is in school. Approximately 71 million children do not receive any post-primary education. The second priority is to make sure that schools deliver a high quality of education. Finally, the third priority is to infuse values into the school curriculums that create a society of people who are tolerant, peaceful, knowledgeable, and critical thinkers.
South Africa has many policies in place to ensure that they meet the priorities set out by the United Nations. The country addresses the first priority by giving every person the right to an education, both basic and higher, as written in the constitution. According to the South African Schools Act of 1996, first through ninth grade is mandatory. Further education takes place in grades 10 to 12. The pass rate of further education in 2012 was 73.9%, a 13.3% increase since 2009. Completion of 12th grade is a requirement for higher education, which is where student earn college level degrees, certificates, and diplomas. As seen in Figure 1, there is a very narrow margin of people who have no education. The Majority of the population, ages 15-19, have a primary education, and many have a secondary education. Thousands of adults also have a tertiary education as well. Referring to Figure 2, the amount of students that have a secondary and tertiary education is projected to increase greatly in the future. South Africa is fulfilling the second priority of delivering a high quality of education in several ways. The country “has one of the highest rates of public investment in education in the world” by investing “about 7% of gross domestic product (GDP) and 20% of total state expenditure” (southafrica.info). Referring to Figure 2.1, the amount of funding that is going towards education is increasing. The government recently created a new strategy in improving the quality of education known as “Action Plan 2014: Towards the Realization of Schooling 2025.” This plan includes a curriculum based on literacy and numeracy, which has specific standards. The goal of the standards is to bridge the gap between “well-resourced and poor schools” (southafrica.info). This plan also introduced standardized tests to make sure that students are on track in their education. Finally, while South Africa is making improvements in regards to teaching students how to be active citizens, it still has strides to go. The South African Schools Act (1996) attempts to created a democracy in schools by setting up School Governing Bodies (SGBs) and Representative Councils of Learners (RCLs). This system teaches students values such as responsibility and accountability. This system represents a participatory democracy. In this way, South Africa has made progress since the apartheid. “Post-apartheid citizenship education policy embraces an updated version of the Athenian prototype of democracy, which promises to develop active characters that contribute to the common welfare of South African society” (Mathebula 53). However, due to “a lack of conceptual clarity, coherence, and consistency in post-apartheid South African educational policy,” (Mathebula 53) the policies have not been well developed leading to “a minimalist conception of democracy (Mathebula 53). Overall, South Africa has a stable and well-developed education system. 20% of the countries state expenditure is spent on education. The system is set up in such a way to prepare students for their future careers. South Africa also has policies in place to teach students the values and skills necessary to be active and involved citizens, although these policies still need to be developed further. Works Cited: Education in South Africa. (2013, February 28). Education in South Africa. Retrieved July 27, 2014, from http://www.southafrica.info/about/education/education.htm - .U9U34zmon9r Mathebula, P. (2009). Citizenship education in South Africa: A critique of post-apartheid citizenship education policy. Johannesburg. Perold, H., Cloete, N., & Papier, J. (2012). Shaping the Future of South African's Youth. Cape Town: African Minds for the Centre for Higher Education Transformation. Priorities. (n.d.). UN Global Education First Initiative – United Nations Secretary General's Global Initiative on Education –. Retrieved July 27, 2014, from http://www.globaleducationfirst.org/priorities.html |
Government System
Oil Production and Consumption
1. Record:
Oil Production: 180.95 bbl/day
Oil Consumption: 595.00 bbl/day
2. Summarize: Write a short paragraph explaining the information you discovered and conclusions you can draw. How does this information help you develop a sense of place for the country -- living conditions, social development, use of land or other resources, etc.?
South Africa produced a relatively small amount of oil. The majority of the oil that they do use is imported from countries in the Middle East and West Africa. South Africa ranks 177 in the world for oil exports, but 23 in the world for oil imports. Instead of using oil, the country relies heavily on coal production. They have a sophisticated industry that produces diesel fuels and gasoline to from coal. About 90% of the countries petroleum production comes from coal and natural gases. South Africa is using modern day technology and equipment in order to produce the petroleum needed. The coal factories create many jobs. Instead of importing large amounts of oil from other countries, they use the natural resources that they have, coal, to create enough energy for themselves.
3. Contemplate:
How much coal does it take to produce the amount of gasoline needed?
Why is it necessary to import oil? What is the imported oil used for?
Economic System
South Africa has a mixed market economic system. This means that the government is allowed to regulate the imports and exports within the country. However, there is a certain level of economic freedom allowed as well. In this type of economic system, the private sector and the public sector work together. The private sector may work to earn a profit. At the same time, the public sector may take over private companies that are harming the public, or going against the public good. There are several advantages to a mixed economy. This type of economy allows entrepreneurs to receive financial reward for their hard work while still having the safety net of the government.
South Africa produces many goods. The main good currently being produced and exported is gold. South Africa is the third highest country in the world exporting gold. They are exporting to countries such as Switzerland, China, and India. This natural resource is mined using sophisticated machinery that is imported from other countries. The gold used by people in South Africa, as well as people in other countries. There is a debate about nationalization in the gold mines. Currently, the mines are privately run. However, many parties are pushing for nationalization of the mines. The government does control the mining policies, laws, rights, as well as overlook the economic growth of the mines. However, many people believe that the government should claim partial ownership of the mines in order to help aid in the mines development as well as better benefit the public good.
Works Cited
Mining and minerals in South Africa. Mining and minerals in South Africa. Retrieved August 4, 2014, from http://www.southafrica.info/business/economy/sectors/mining.htm-nationalisation
"Mixed Economy." Economics Help. Economics Help: Helping to Simplify Economics, n.d. Web. 4 Aug. 2014. <http://www.economicshelp.org/blog/glossary/mixed-economy/>.
Simoes, A. Learn More About Trade in South Africa. OEC: South Africa (ZAF) Profile of Exports, Imports and Trade Partners. Retrieved August 3, 2014, from http://atlas.media.mit.edu/profile/country/zaf/
Population below poverty line:
South Africa: 31.3% (2009 est.)
Swaziland: 68% (2006 est.)
Zimbabwe: 68% (2004 est.)
While of these countries has a high percentage of people living below the poverty line, South Africa’s poverty line is significantly lower than Swaziland and Zimbabwe. Although the figures for each country are for different years, a level of consistency can be assumed during this relatively brief period. Just under one-third of the South African population are living below the poverty line as compared to those living Swaziland and Zimbabwe, at approximately two-thirds. Looking at the percentages of people living below the poverty line, South Africa has a lower poverty rate then its neighboring countries. This may be due to its advanced economy and education system. However, percentages may not be entirely objective as the definition of the poverty line differs between countries.
By way of comparison, 15.1% of those in the U.S.A. are living below the poverty line (by the 2010 estimate).
GDP per capita– (2013 est.)
South Africa: $11,500.00
Swaziland: $5,700
Zimbabwe: $600.00
Gross Domestic Product (GDP) per capita is arrived at by dividing the GDP of the entire country by the number of people in that country. GDP per capita is thus a theoretical indication of the level of prosperity or wealth enjoyed by each person.
The GDP per capita in South Africa is roughly twice that of Swaziland and about ten times that of Zimbabwe. This means that in addition people generally are earning more money in South Africa then they are in their neighboring countries of Swaziland and Zimbabwe. This is compatible with the relatively low poverty rate described above.
By contrast, the GPD per capita in the United States for this period was $52,800.
Labor force - by occupation:
South Africa:
agriculture: 9%
industry: 26%
services: 65% (2007 est.)
South Africa is primarily a service industry rather than an agricultural society.
Swaziland:
agriculture: 70%
industry: NA%
services: NA%
Swaziland appears to be almost entirely an agricultural society, with the vast majority of the labor force working in agriculture.
Zimbabwe:
agriculture: 66%
industry: 10%
services: 24% (1996)
Zimbabwe is primarily an agricultural society, with two-thirds of its labor force employed in agriculture.
Less than 10% of South Africans work in agriculture, which is much less then the percentage of those working agriculture in Swaziland and Zimbabwe. However, approximately 65% of people in South Africa are working in Service as compared to 24% of people working in service in Zimbabwe. South Africa is much more of a service industry, while Swaziland and Zimbabwe are agricultural industries. Therefore, South Africa brings in more wealth and success then its neighboring countries.
Works Cited
Amadeo, K. (n.d.). GDP Per Capita. About.com US Economy. Retrieved August 4, 2014, from http://useconomy.about.com/od/glossary/g/Gdp-Per-Capita.htm
The World Factbook: South Africa. (2014, June 20). Central Intelligence Agency. Retrieved August 3, 2014, from https://www.cia.gov/library/publications/the-world-factbook/geos/gr.html
